Node.js Performance Monitoring: CPU, Memory, Event Loop, and Bottleneck Detection
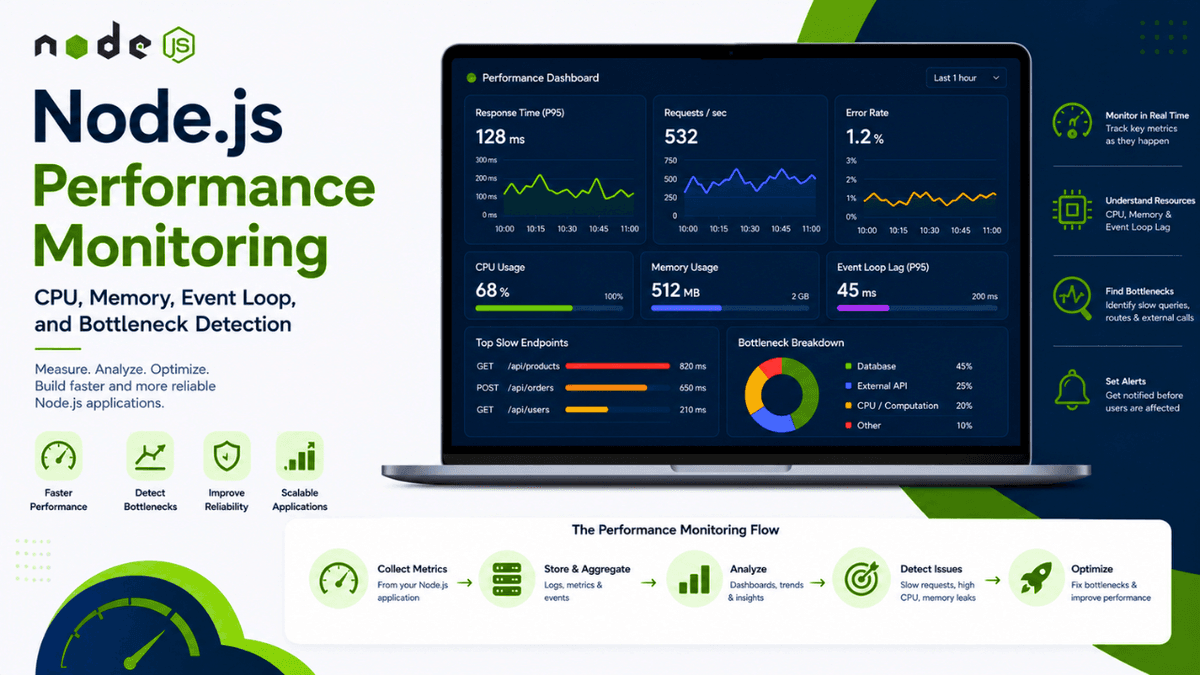
Learn Node.js performance monitoring with practical techniques for tracking CPU, memory, event loop lag, response times, profiling, bottleneck detection, and production performance.
Node.js Performance Monitoring: CPU, Memory, Event Loop, and Bottleneck Detection
A Node.js application can be working correctly and still have serious performance problems.
Your API may return the correct response.
Your database queries may succeed.
Your users may be able to log in.
But the application can still be:
- Slow
- Consuming excessive memory
- Using too much CPU
- Blocking the event loop
- Taking too long to respond
- Crashing under heavy traffic
This is why performance monitoring is an important part of building production-ready Node.js applications.
In the previous article, we explored Logging in Node.js and learned how structured logs can help us understand what happened inside an application.
Now we will take the next step.
We'll learn how to measure application performance, identify bottlenecks, monitor CPU and memory usage, understand event-loop performance, and investigate slow Node.js applications.
What Is Performance Monitoring?
Performance monitoring is the process of measuring how efficiently your application is running.
It helps you understand:
- How fast requests are processed
- How much CPU the application uses
- How much memory it consumes
- Whether the event loop is blocked
- Which operations are slow
- Where bottlenecks exist
- Whether performance degrades over time
A simplified view looks like this:
  User Request
     ↓
Node.js Server
     ↓
Application Logic
     ↓
Database / External API
     ↓
Response
     ↓
Measure Performance
The goal is to identify where time and resources are being spent.
Why Performance Monitoring Matters
Imagine an API endpoint:
GET /api/products
The endpoint works correctly.
But it takes:
3 seconds
to respond.
A few users might tolerate that.
But imagine thousands of users making requests simultaneously.
Now your system may experience:
  Slow Requests
     ↓
More Concurrent Requests
     ↓
Higher Resource Usage
     ↓
More Slow Requests
     ↓
System Overload
Performance problems can become scalability problems.
Monitoring helps you detect these issues before they become serious.
The Main Performance Metrics
A Node.js application can be monitored using several important metrics.
Request Latency
How long does a request take?
  GET /api/users → 45ms
GET /api/products → 120ms
POST /api/orders → 850ms
Throughput
How many requests can the application process?
1,000 requests/minute
Error Rate
How many requests fail?
  Successful: 98%
Failed: 2%
CPU Usage
How much CPU is being consumed?
CPU: 75%
Memory Usage
How much memory is being used?
Memory: 500 MB
Event Loop Lag
How much is the Node.js event loop being delayed?
Event Loop Lag: 150ms
Database Latency
How long do database operations take?
Query: 20ms
These metrics help create a picture of your application's health.
Request Response Time
One of the easiest performance metrics to understand is response time.
For example:
  Request Started
      ↓
Application Processing
      ↓
Database Query
      ↓
Response Sent
If this takes 50ms:
Response Time = 50ms
If it takes 5 seconds:
Response Time = 5000ms
The second request clearly requires investigation.
Measuring Request Duration
You can measure request duration with middleware.
For example:
  app.use((req, res, next) => {
  const start = process.hrtime.bigint();

  res.on("finish", () => {
    const end = process.hrtime.bigint();

    const duration =
      Number(end - start) / 1_000_000;

    console.log({
      method: req.method,
      path: req.originalUrl,
      statusCode: res.statusCode,
      duration: `${duration.toFixed(2)}ms`
    });
  });

  next();
});
The result might look like:
GET /api/users 200 32.45ms
This gives you a basic understanding of endpoint performance.
For production systems, this information is often sent to a monitoring or observability platform.
Why Average Response Time Isn't Enough
Suppose you have:
Average response time: 100ms
That sounds good.
But the average could hide slow requests.
For example:
  95% requests → 50ms
4% requests → 500ms
1% requests → 10 seconds
The average doesn't tell the full story.
This is why performance monitoring often uses percentiles .
Understanding Percentiles
Common metrics include:
- P50
- P90
- P95
- P99
P50
The median response time.
50% of requests are faster than this value.
P95
95% of requests are faster than this value.
P99
99% of requests are faster than this value.
Imagine:
  P50 = 40ms
P95 = 200ms
P99 = 1500ms
Most requests are fast.
But a small percentage are extremely slow.
P95 and P99 are often more useful for understanding real user experience than averages alone.
CPU Monitoring
CPU usage tells you how much processing power your Node.js application is consuming.
You can inspect CPU usage using Node.js APIs.
For example:
  const os = require("os");

console.log(
  os.loadavg()
);
On Unix-like systems, loadavg() provides system load information.
You can also inspect process CPU usage:
  const startUsage =
  process.cpuUsage();

setTimeout(() => {
  const usage =
    process.cpuUsage(startUsage);

  console.log(usage);
}, 1000);
This can help measure CPU consumption by your process.
However, application-level measurements should usually be combined with system-level monitoring.
High CPU Usage
High CPU usage can happen because of:
- Complex calculations
- Large loops
- Synchronous operations
- Inefficient algorithms
- CPU-heavy data processing
- JSON serialization of huge objects
- Regular expression problems
- Blocking code
For example:
  app.get("/slow", (req, res) => {
  let total = 0;

  for (let i = 0; i < 1e10; i++) {
    total += i;
  }

  res.json({
    total
  });
});
This is CPU-intensive.
While this code executes, the main Node.js thread is busy.
That can affect other requests.
Memory Monitoring
Node.js applications use memory for:
- Objects
- Arrays
- Buffers
- Closures
- Caches
- Database results
You can inspect memory usage with:
  console.log(
  process.memoryUsage()
);
The result contains information such as:
  rss
heapTotal
heapUsed
external
arrayBuffers
Example:
  const memory =
  process.memoryUsage();

console.log({
  heapUsed: memory.heapUsed,
  heapTotal: memory.heapTotal,
  rss: memory.rss
});
Understanding Memory Metrics
heapUsed
Memory currently used by JavaScript objects.
heapTotal
Total memory allocated for the V8 heap.
rss
Resident Set Size.
This represents the total memory occupied by the process in RAM.
external
Memory used by resources outside the V8 heap but managed by Node.js.
arrayBuffers
Memory allocated for ArrayBuffer and related structures.
Monitoring these values can help identify memory problems.
Memory Leaks
A memory leak occurs when your application continues holding references to objects that are no longer needed.
Conceptually:
  Request
  ↓
Create Object
  ↓
Object No Longer Needed
  ↓
Reference Still Exists
  ↓
Garbage Collector Can't Remove It
  ↓
Memory Usage Grows
Over time:
  100 MB
 ↓
200 MB
 ↓
400 MB
 ↓
800 MB
 ↓
Crash
This is a serious production problem.
Common Causes of Memory Leaks
Memory leaks can come from:
- Global variables
- Growing arrays
- Unbounded caches
- Event listeners that aren't removed
- Timers that remain active
- Closures holding references
- Long-lived objects
- Incorrect caching strategies
For example:
  const cache = [];

app.get("/data", async (req, res) => {
  const data = await fetchData();

  cache.push(data);

  res.json(data);
});
If cache grows indefinitely, memory usage may continuously increase.
Monitoring Memory Over Time
A single memory measurement isn't enough.
You want to observe trends.
For example:
  10:00 → 200 MB
10:10 → 220 MB
10:20 → 260 MB
10:30 → 320 MB
10:40 → 400 MB
This pattern may indicate a memory leak.
Healthy applications should generally show predictable memory behavior rather than continuously growing without recovery.
Garbage Collection
Node.js uses the V8 JavaScript engine, which includes automatic garbage collection.
The garbage collector identifies objects that are no longer reachable and reclaims memory.
Conceptually:
  Create Objects
      ↓
Objects Become Unused
      ↓
Garbage Collector
      ↓
Memory Reclaimed
You don't manually free normal JavaScript objects.
However, garbage collection itself consumes CPU time.
If your application creates excessive temporary objects, garbage collection may happen frequently.
This can affect performance.
Event Loop Performance
The Node.js event loop is one of the most important concepts for understanding Node.js performance.
Node.js uses an event-driven architecture that allows JavaScript code to handle many I/O operations efficiently.
Conceptually:
  Request
   ↓
Event Loop
   ↓
Async Operation
   ↓
Callback / Promise
   ↓
Event Loop
   ↓
Response
The event loop allows Node.js to continue handling other work while certain I/O operations are pending.
However, the event loop can still be blocked.
Blocking the Event Loop
Consider:
  app.get("/bad", (req, res) => {
  let total = 0;

  for (let i = 0; i < 1e10; i++) {
    total += i;
  }

  res.json({
    total
  });
});
While this loop runs, the main thread is busy.
Imagine another request arrives:
  Request A
   ↓
CPU-Heavy Loop
   ↓
Event Loop Blocked

Request B
   ↓
Waiting
Even though Request B is unrelated, it may have to wait.
This is one of the most important performance risks in Node.js.
Detecting Event Loop Lag
You can monitor event-loop delay using Node.js performance APIs.
For example:
  const {
  monitorEventLoopDelay
} = require("perf_hooks");

const histogram =
  monitorEventLoopDelay({
    resolution: 20
  });

histogram.enable();

setInterval(() => {
  console.log({
    mean: histogram.mean,
    max: histogram.max
  });
}, 5000);
This can help identify event-loop delays.
In production systems, dedicated monitoring tools often provide better visibility.
Why Event Loop Lag Matters
Suppose:
Event Loop Lag = 5ms
This may be normal.
But:
Event Loop Lag = 500ms
means callbacks and requests may be delayed.
Users may experience:
  Slow API responses
Timeouts
Poor user experience
High event-loop lag is often a signal that synchronous or CPU-heavy work is blocking the main thread.
Synchronous APIs and Performance
Node.js provides synchronous APIs.
For example:
fs.readFileSync();
These operations block the current execution thread.
For small scripts, this may be acceptable.
For high-throughput servers, excessive synchronous operations can become a performance problem.
Prefer asynchronous APIs for server-side request processing when appropriate.
Instead of:
  const data =
  fs.readFileSync(
    "file.txt",
    "utf8"
  );
Consider:
  const data =
  await fs.promises.readFile(
    "file.txt",
    "utf8"
  );
The exact choice depends on the context.
Database Performance
Many Node.js performance problems are actually database problems.
Consider:
  Client
  ↓
Node.js API
  ↓
Database
  ↓
Slow Query
  ↓
Slow API Response
Your Node.js code may be fast.
But if the database query takes:
3 seconds
the API will still be slow.
Monitor:
- Query duration
- Connection pool usage
- Slow queries
- Database CPU
- Index usage
- Number of database calls
Database performance should be monitored alongside Node.js performance.
The N+1 Query Problem
Imagine fetching 100 users:
  const users =
  await User.find();

for (const user of users) {
  user.posts =
    await Post.find({
      userId: user.id
    });
}
This may produce:
  1 query for users
+
100 queries for posts
=
101 database queries
This is known as the N+1 query problem.
The application may become significantly slower as the number of users grows.
Performance monitoring can reveal this pattern.
External API Performance
External services can also slow down your application.
For example:
  Node.js API
    ↓
Payment API
    ↓
5 second response
Your endpoint now takes at least five seconds.
Monitor:
- External request duration
- Timeout rates
- Error rates
- Retry counts
- Rate-limit responses
Don't assume every slow request is caused by your own code.
Profiling
Monitoring tells you that something is slow.
Profiling helps you understand why .
A profiler can show where your application spends CPU time.
For example:
  Function A → 10%
Function B → 20%
Function C → 60%
Function D → 10%
Now you know where to investigate.
Node.js provides built-in profiling and diagnostic capabilities.
You can also use browser DevTools and other profiling tools.
Node.js Inspector
Node.js includes an Inspector protocol that can be used for debugging and profiling.
You can start an application with:
node --inspect app.js
You can then connect to the Node.js process using compatible developer tools.
For CPU-intensive problems, profiling can help identify expensive functions.
This builds naturally on the debugging concepts discussed earlier in our Node.js series.
CPU Profiling
CPU profiling helps answer:
Which functions are consuming the most CPU?
For example:
  processData()       45%
calculateMetrics()   30%
serializeResponse()  15%
other                10%
Now you have a direction for optimization.
Without profiling, you may waste time optimizing code that isn't actually causing the problem.
Heap Snapshots
Heap snapshots help investigate memory usage.
You can compare snapshots over time:
  Snapshot 1
    ↓
Run Application
    ↓
Snapshot 2
    ↓
Compare
If a particular object type continues increasing, it may indicate a memory leak.
Heap snapshots are especially useful when memory usage grows continuously.
Garbage Collection Monitoring
Frequent garbage collection can indicate excessive allocation.
For example:
  Application Running
      ↓
Allocate Many Objects
      ↓
Garbage Collection
      ↓
Allocate Again
      ↓
Garbage Collection
If this happens too frequently, application performance may suffer.
Monitoring memory patterns can help identify whether garbage collection is contributing to latency.
Performance Bottlenecks
A bottleneck is a component that limits overall system performance.
For example:
  API
 ↓
Business Logic → 20ms
 ↓
Database → 2 seconds
 ↓
Response
The database is the bottleneck.
Another example:
  API
 ↓
CPU Calculation → 3 seconds
 ↓
Database → 20ms
The CPU-heavy calculation is the bottleneck.
The key principle is:
Optimize the bottleneck, not everything.
Common Node.js Bottlenecks
Common bottlenecks include:
- Slow database queries
- Missing database indexes
- Blocking synchronous operations
- CPU-heavy calculations
- Large JSON serialization
- Excessive network calls
- Slow external APIs
- Memory leaks
- Inefficient algorithms
- Excessive logging
Performance monitoring helps identify which one is actually responsible.
Large JSON Responses
Returning huge objects can be expensive.
For example:
  res.json(
  thousandsOfLargeObjects
);
This can consume:
- CPU
- Memory
- Network bandwidth
Instead, consider:
- Pagination
- Field selection
- Compression
- Streaming
- Smaller response payloads
For example:
GET /api/users?page=1&limit=20
is generally better than returning hundreds of thousands of records at once.
Pagination
Instead of:
GET /api/products
returning everything, use pagination:
GET /api/products?page=1&limit=20
This reduces:
- Database work
- Memory usage
- Serialization cost
- Network transfer
Pagination is a simple but powerful performance technique.
Caching
Caching can reduce repeated expensive operations.
For example:
  Request
  ↓
Check Cache
  ↓
Data Exists?
 ↙       ↘
Yes       No
 ↓         ↓
Return    Database
            ↓
          Cache
            ↓
          Return
Caching can improve response times.
However, poorly designed caches can create memory problems or stale data.
Always define:
- Cache size
- Expiration
- Invalidation strategy
Measuring Before Optimizing
One of the most important performance principles is:
Measure first. Optimize second.
Don't assume:
"This function looks slow."
Instead:
  Measure
   ↓
Identify Bottleneck
   ↓
Optimize
   ↓
Measure Again
Without measurement, optimization becomes guesswork.
Performance Monitoring in Production
A production monitoring strategy might collect:
  Request Rate
Error Rate
Latency
CPU Usage
Memory Usage
Event Loop Lag
Database Latency
External API Latency
You can visualize these metrics over time.
For example:
  Traffic ↑
    ↓
CPU ↑
    ↓
Latency ↑
    ↓
Error Rate ↑
This can reveal system behavior under load.
The Four Golden Signals
A useful monitoring model is the four golden signals:
Latency
How long requests take.
Traffic
How much demand the system receives.
Errors
How many requests fail.
Saturation
How close the system is to its resource limits.
For example:
  Latency: 200ms
Traffic: 500 req/s
Errors: 1%
CPU: 85%
Memory: 80%
Together, these metrics provide a useful high-level view of application health.
Health Checks
A production Node.js service often provides a health endpoint.
For example:
  app.get("/health", (req, res) => {
  res.status(200).json({
    status: "ok"
  });
});
A more advanced health check may verify dependencies.
For example:
  Application
    ↓
Health Check
    ↓
Database Available?
    ↓
External Dependencies Available?
However, be careful not to make health checks unnecessarily expensive.
Readiness vs Liveness
In production environments, it's useful to distinguish between:
Liveness
Is the application process alive?
Process Running?
Readiness
Is the application ready to receive traffic?
Can Serve Requests?
An application might be alive but not ready because the database connection hasn't been established.
This distinction becomes particularly important in container orchestration environments.
Monitoring Node.js in Production
A production architecture may look like:
  Users
  ↓
Load Balancer
  ↓
Node.js Application
  ↓
Logs + Metrics + Traces
  ↓
Monitoring Platform
  ↓
Alerts
The goal is not simply to collect data.
The goal is to detect problems early.
For example:
  Error Rate > 5%
        ↓
Alert
        ↓
Investigate
        ↓
Identify Root Cause
        ↓
Fix
Setting Performance Alerts
You can define thresholds.
For example:
  P95 latency > 500ms
CPU > 90%
Memory > 85%
Error rate > 2%
Event loop lag > 100ms
When a threshold is exceeded, an alert can be triggered.
The exact thresholds depend on your application.
Avoid setting arbitrary alerts without understanding normal system behavior.
Performance Budgets
A performance budget defines acceptable limits.
For example:
  P95 API latency < 300ms
Error rate < 1%
CPU < 70%
Memory < 75%
Budgets help teams maintain performance over time.
If a new feature causes latency to increase significantly, the team can investigate before the problem becomes normalized.
Load Testing
Monitoring tells you how the application performs under real traffic.
Load testing helps you understand how it behaves under controlled traffic.
For example:
  100 requests/sec
      ↓
500 requests/sec
      ↓
1000 requests/sec
      ↓
Find Breaking Point
Load testing can reveal:
- Maximum throughput
- CPU limits
- Memory behavior
- Database bottlenecks
- Event-loop blocking
- Error rates
This is especially useful before major production launches.
Node.js Performance Checklist
Before deploying a Node.js application, ask:
  1. Are request durations monitored?
2. Are P95 and P99 latencies tracked?
3. Is CPU usage monitored?
4. Is memory usage monitored?
5. Is event-loop lag monitored?
6. Are database queries measured?
7. Are external API calls measured?
8. Are errors tracked?
9. Are health checks available?
10. Are performance alerts configured?
If you can answer these questions confidently, you're building a stronger production system.
A Practical Performance Monitoring Architecture
A simple production architecture could look like:
                     ┌──────────────┐
                   │    Users     │
                   └──────┬───────┘
                          ↓
                   ┌──────────────┐
                   │ Load Balancer│
                   └──────┬───────┘
                          ↓
                   ┌──────────────┐
                   │ Node.js API  │
                   └──────┬───────┘
                          ↓
              ┌───────────┴───────────┐
              ↓                       ↓
       ┌─────────────┐        ┌──────────────┐
       │  Database   │        │ External API │
       └─────────────┘        └──────────────┘

              Node.js Metrics
                     ↓
       ┌─────────────────────────┐
       │ Logs / Metrics / Traces │
       └────────────┬────────────┘
                    ↓
             Monitoring System
                    ↓
                 Alerts
This architecture helps you understand not only your Node.js process but also the dependencies around it.
The Difference Between Monitoring and Profiling
These concepts are related but different.
Monitoring
Answers:
Is the system healthy?
You might monitor:
  CPU
Memory
Latency
Errors
Traffic
Profiling
Answers:
Where is the application spending its resources?
You might profile:
  CPU Functions
Memory Objects
Execution Time
A useful workflow is:
  Monitoring
   ↓
Detect Problem
   ↓
Profiling
   ↓
Find Bottleneck
   ↓
Optimize
   ↓
Monitor Again
Performance Monitoring Best Practices
Measure Real User Impact
Don't optimize metrics that don't affect users.
Focus on meaningful signals such as latency and errors.
Track Percentiles
P95 and P99 often reveal slow requests that averages hide.
Monitor Dependencies
Your Node.js application may be fast while your database or external API is slow.
Watch Trends
A gradual increase in memory usage can be more important than a single high reading.
Monitor the Event Loop
Blocking the event loop can affect many users at once.
Profile Before Optimizing
Use evidence instead of assumptions.
Set Alerts
Monitoring without alerts may mean problems go unnoticed.
Avoid Excessive Monitoring Overhead
Monitoring should provide value without becoming a significant performance burden.
What's Next?
We now understand how to monitor Node.js performance and identify potential bottlenecks.
But performance is only one part of building a production application.
Security is equally important.
A fast application that exposes passwords, secrets, or sensitive user information is still a dangerous application.
In the next part of this series, we'll begin exploring Node.js Security Best Practices , starting with Password Hashing with Crypto .
We'll learn how passwords should be transformed before storage, why passwords must never be stored as plain text, the difference between hashing and encryption, and how password security fits into a real authentication system.
Conclusion
Performance monitoring helps you move from guessing to measuring.
Instead of saying:
"Users say the application is slow."
you can investigate:
  P95 latency: 850ms
Database latency: 700ms
CPU: 45%
Memory: 60%
Event loop lag: 10ms
Now you have evidence.
You can identify the real bottleneck instead of randomly changing code.
A reliable Node.js performance strategy should monitor:
- Request latency
- P95 and P99 response times
- Throughput
- Error rates
- CPU usage
- Memory usage
- Event-loop lag
- Database performance
- External API latency
The most important principle is simple:
  Measure
   ↓
Identify
   ↓
Optimize
   ↓
Measure Again
Don't optimize everything.
Find the bottleneck.
Fix the bottleneck.
Then measure again.
That's how you turn performance optimization from guesswork into engineering.