Logging in Node.js: Structured Logs, Log Levels, and Production Best Practices
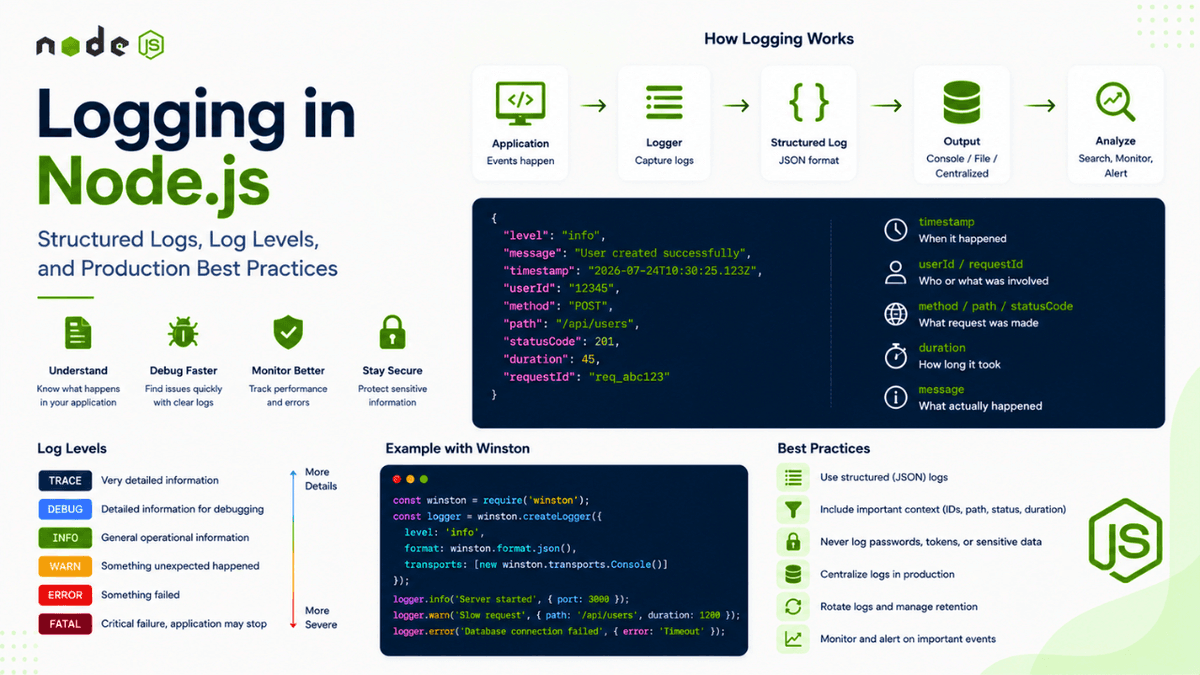
Learn Node.js logging best practices with practical examples covering console logging, log levels, structured logs, request logging, error logging, Winston, Pino, log rotation, production logging, and observability.
Logging in Node.js: Structured Logs, Log Levels, and Production Best Practices
When your Node.js application is small, debugging can be relatively simple.
You can run:
npm run dev
Then look at:
console.log();
But as your application grows, things become more complicated.
You may have:
- Multiple API endpoints
- Database queries
- Authentication
- Background jobs
- External APIs
- File uploads
- Payment systems
- Multiple servers
- Production deployments
At that point, simply printing messages to the terminal isn't enough.
You need a proper logging strategy .
Good logging helps you understand what your application is doing, investigate failures, debug production issues, and monitor system behavior.
In the previous article, we explored Node.js Error Handling Best Practices and learned how to handle errors safely and consistently.
Logging is the next important piece.
Your application needs to do more than handle an error.
It should also record enough information to help you understand what happened, when it happened, and why it happened .
What Is Logging?
Logging is the process of recording information about an application's behavior.
For example:
  Server started
Database connected
User created
Request received
Payment completed
Error occurred
A log entry might look like:
2026-07-24 10:30:25 INFO Server started on port 3000
Another might be:
2026-07-24 10:32:10 ERROR Database connection failed
Logs provide a history of what happened inside your application.
Why Is Logging Important?
Imagine your API works perfectly during development.
You deploy it to production.
Two hours later, a user reports:
"The application isn't working."
You can't reproduce the problem locally.
Without logs, you may have no idea what happened.
With proper logs, you might find:
  10:32:01 INFO Request received
10:32:01 INFO User authenticated
10:32:02 INFO Database query started
10:32:12 ERROR Database query timeout
Now you have a starting point.
Logging helps answer questions such as:
- What happened?
- When did it happen?
- Which endpoint was involved?
- Which operation failed?
- How long did it take?
- Was the problem caused by an external service?
- Did the database respond?
- Did the application restart?
Good logs turn unknown problems into observable events.
console.log()
Node.js provides a simple built-in logging mechanism:
console.log("Server started");
You can also use:
console.error("Something went wrong");
console.warn("Warning");
console.info("Information");
For small projects, these methods may be enough.
Example:
  const PORT = 3000;

app.listen(PORT, () => {
  console.log(`Server running on port ${PORT}`);
});
This is perfectly reasonable for a simple application.
However, larger applications need more structure.
The Problem with console.log()
Consider:
  console.log("User created");
console.log("Database connected");
console.log("Request received");
console.log("Payment failed");
After a few hundred log messages, you may struggle to answer:
- Which message is important?
- Which message is an error?
- When did this happen?
- Which request caused it?
- Which user was involved?
This is why production applications usually use structured logging.
Log Levels
A log level indicates the importance or severity of a log message.
Common levels include:
  TRACE
DEBUG
INFO
WARN
ERROR
FATAL
Not every application needs every level, but understanding them is important.
TRACE
TRACE is usually the most detailed level.
It can be used to record very fine-grained execution information.
For example:
  TRACE Entering calculateTotal()
TRACE Processing item 1
TRACE Processing item 2
TRACE Exiting calculateTotal()
This level can generate a huge amount of data.
It's generally useful for deep troubleshooting rather than normal production logging.
DEBUG
DEBUG provides information useful to developers.
Example:
  DEBUG User ID: 123
DEBUG Query parameters: { role: "admin" }
DEBUG Database query started
Debug logs are helpful when investigating problems.
You may enable them during development or troubleshooting.
INFO
INFO represents normal application activity.
Examples:
  INFO Server started
INFO Database connected
INFO User registered
INFO Payment completed
These events usually indicate normal behavior.
WARN
WARN indicates something unusual that isn't necessarily a failure.
Example:
WARN API response took longer than expected
Another example:
WARN User attempted an expired token
The application may continue running normally.
However, the situation deserves attention.
ERROR
ERROR indicates that something failed.
Example:
ERROR Database query failed
Or:
ERROR Failed to process payment
Errors should usually be investigated.
FATAL
FATAL represents a critical failure that may require the application to stop.
For example:
FATAL Unable to initialize required database connection
The exact use of this level depends on your logging library and architecture.
Log Level Hierarchy
A typical hierarchy looks like:
  TRACE
  ↓
DEBUG
  ↓
INFO
  ↓
WARN
  ↓
ERROR
  ↓
FATAL
The higher the severity, the more important the event.
A production system might log:
  INFO
WARN
ERROR
FATAL
while development may include:
DEBUG
as well.
Structured Logging
Structured logging means storing logs in a consistent machine-readable format.
For example:
  {
  "level": "info",
  "message": "User created",
  "userId": "12345"
}
Instead of:
User 12345 was created successfully
Structured logs are easier for machines to process.
Logging systems can search and filter fields such as:
  level
userId
requestId
route
statusCode
duration
This becomes extremely valuable when your application generates thousands or millions of log entries.
Example Structured Log
A request log might look like:
  {
  "level": "info",
  "message": "Request completed",
  "method": "GET",
  "path": "/api/users",
  "statusCode": 200,
  "duration": 45
}
Now you can easily search:
statusCode = 500
or:
path = /api/users
or:
duration > 1000
This is much harder with plain text logs.
JSON Logging
JSON is a popular format for structured logs.
Example:
  console.log(
  JSON.stringify({
    level: "info",
    message: "Server started",
    port: 3000
  })
);
Output:
  {
  "level": "info",
  "message": "Server started",
  "port": 3000
}
In production, dedicated logging libraries usually handle this automatically.
Winston
One popular Node.js logging library is Winston .
Install it:
npm install winston
Create a logger:
  const winston = require("winston");

const logger = winston.createLogger({
  level: "info",
  format: winston.format.json(),
  transports: [
    new winston.transports.Console()
  ]
});

module.exports = logger;
Now use:
logger.info("Server started");
Or:
logger.error("Database connection failed");
You can also attach structured metadata:
  logger.info("User created", {
  userId: "12345"
});
A logging library gives you more control than raw console.log() .
Pino
Another popular Node.js logger is Pino .
Install it:
npm install pino
Basic usage:
  const pino = require("pino");

const logger = pino();

logger.info("Server started");
You can include metadata:
  logger.info(
  {
    userId: "12345"
  },
  "User created"
);
Pino is designed with performance in mind and is commonly used in Node.js services.
Winston vs Pino
Both are useful.
A simplified comparison:
| Feature | Winston | Pino |
|---|---|---|
| Structured logging | Yes | Yes |
| JSON logs | Yes | Yes |
| Multiple transports | Strong support | Supported through ecosystem |
| Performance focus | General purpose | High performance |
| Flexible formatting | Excellent | Excellent |
| Node.js production use | Common | Common |
The right choice depends on your application requirements and team preferences.
The most important thing isn't which library you choose.
It's having a consistent logging strategy.
Creating a Logger Module
Instead of creating a logger in every file, create one centralized module.
For example:
  src/
├── config/
├── controllers/
├── routes/
├── services/
├── utils/
└── logger.js
Example:
  const winston = require("winston");

const logger = winston.createLogger({
  level: "info",
  format: winston.format.json(),
  transports: [
    new winston.transports.Console()
  ]
});

module.exports = logger;
Then use it anywhere:
  const logger = require("./logger");

logger.info("Application started");
This keeps your logging configuration centralized.
Logging HTTP Requests
API applications should usually log incoming requests.
For example:
  GET /api/users
POST /api/users
DELETE /api/users/123
Useful request information includes:
- HTTP method
- URL
- Status code
- Response time
- User agent
- Request ID
A request log might look like:
  {
  "level": "info",
  "message": "Request completed",
  "method": "GET",
  "path": "/api/users",
  "statusCode": 200,
  "duration": 32
}
This makes API debugging much easier.
Request Logging with Morgan
For Express applications, Morgan is a popular HTTP request logger.
Install it:
npm install morgan
Use it:
  const morgan = require("morgan");

app.use(morgan("combined"));
Now incoming HTTP requests are logged automatically.
For example:
GET /api/users 200 32 ms
Morgan is useful for basic HTTP access logging.
For more advanced structured logging, you can integrate request logging with a logger such as Winston or Pino.
Logging Request Duration
Slow requests are often an important performance signal.
You can measure request duration.
Conceptually:
  Request Started
      ↓
Record Start Time
      ↓
Process Request
      ↓
Response Sent
      ↓
Calculate Duration
Example middleware:
  app.use((req, res, next) => {
  const start = Date.now();

  res.on("finish", () => {
    const duration =
      Date.now() - start;

    console.log({
      method: req.method,
      path: req.originalUrl,
      statusCode: res.statusCode,
      duration
    });
  });

  next();
});
Now you can identify slow requests.
For example:
  {
  "method": "GET",
  "path": "/api/products",
  "statusCode": 200,
  "duration": 1200
}
If most requests take 30ms but one endpoint takes 1200ms, that's worth investigating.
Logging Errors
Error logs should contain useful information.
For example:
  logger.error("Database query failed", {
  error: error.message,
  stack: error.stack
});
You might also include:
  requestId
method
path
userId
operation
Example:
  {
  "level": "error",
  "message": "Database query failed",
  "requestId": "req_123",
  "method": "GET",
  "path": "/api/users",
  "error": "Connection timeout"
}
This makes troubleshooting significantly easier.
Logging in Error Middleware
If you've implemented centralized error handling, logging can happen there.
Example:
  app.use((err, req, res, next) => {
  logger.error("Request failed", {
    message: err.message,
    stack: err.stack,
    method: req.method,
    path: req.originalUrl
  });

  res.status(
    err.statusCode || 500
  ).json({
    success: false,
    message: "Something went wrong"
  });
});
Now unexpected errors are logged consistently.
This works well alongside the error-handling architecture discussed in our previous article.
Logging Database Operations
You may want to log important database operations.
For example:
  logger.debug("Fetching user", {
  userId
});
After completion:
  logger.info("User fetched", {
  userId
});
If something fails:
  logger.error("Failed to fetch user", {
  userId,
  error: error.message
});
However, don't log every database operation in production unless you have a specific reason.
Excessive database logging can create:
- Large log volumes
- Higher storage costs
- Performance overhead
- Difficult-to-search logs
Log meaningful events.
Logging Authentication Events
Authentication systems benefit from useful security logs.
Examples include:
  Login successful
Login failed
Token expired
Password reset requested
Account locked
For example:
  logger.warn("Login failed", {
  email,
  reason: "Invalid credentials"
});
However, be careful.
Never log:
  password
JWT token
refresh token
API key
secret
Sensitive credentials should never appear in logs.
Never Log Passwords
Bad:
  logger.info("User login", {
  email,
  password
});
This is a serious security problem.
Better:
  logger.info("Login attempt", {
  email
});
Even then, consider whether storing the email in logs is appropriate for your application and privacy requirements.
Never Log Authentication Tokens
Avoid:
console.log(req.headers.authorization);
or:
  logger.debug({
  token
});
Access tokens and refresh tokens are sensitive.
If they appear in logs, anyone with access to those logs may potentially misuse them.
Logs should be treated as sensitive data.
Personal Data and Privacy
Be careful with personally identifiable information.
Depending on your application, avoid logging unnecessary:
- Email addresses
- Phone numbers
- Addresses
- Identity information
- Payment information
Only log what you actually need for debugging, operations, and security.
Request IDs
A request ID uniquely identifies a request.
For example:
req_abc123
A request may produce multiple logs:
  req_abc123 Request received
req_abc123 Authentication successful
req_abc123 Database query started
req_abc123 Database query completed
req_abc123 Response sent
This allows you to follow a request through your application.
Without request IDs, logs from many concurrent requests can become difficult to correlate.
Correlation IDs
In larger distributed systems, one request may travel through multiple services.
For example:
  Client
  ↓
API Gateway
  ↓
User Service
  ↓
Payment Service
  ↓
Notification Service
A correlation ID can connect logs across all these services.
Conceptually:
  Request ID: abc123

API Gateway       → abc123
User Service      → abc123
Payment Service   → abc123
Notification      → abc123
This is extremely useful when debugging distributed systems.
Logging External API Calls
If your application calls an external service, log important details.
For example:
  {
  "level": "info",
  "message": "External API request",
  "service": "payment-provider",
  "operation": "create-payment"
}
After completion:
  {
  "level": "info",
  "message": "External API completed",
  "service": "payment-provider",
  "statusCode": 200,
  "duration": 450
}
If it fails:
  {
  "level": "error",
  "message": "External API failed",
  "service": "payment-provider",
  "statusCode": 503
}
This helps identify whether failures originate inside your application or from a dependency.
Logging Environment Information
At application startup, you may log basic environment information.
For example:
  logger.info("Application started", {
  environment: process.env.NODE_ENV,
  port: process.env.PORT
});
Avoid logging secrets.
Never do:
  logger.info({
  databaseUrl: process.env.MONGO_URI
});
If the URL contains credentials, you've just exposed sensitive information.
Development Logging
During development, detailed logs can be useful.
For example:
  DEBUG User request received
DEBUG Query parameters
DEBUG Database query
DEBUG Database response
This helps you understand application behavior.
Tools such as Nodemon can also improve the development feedback loop by restarting your application automatically when source files change.
Production Logging
Production logging should be more intentional.
A typical strategy might be:
  INFO
WARN
ERROR
FATAL
You may avoid verbose debug logs unless troubleshooting a specific issue.
Production logs should be:
- Structured
- Searchable
- Secure
- Centralized
- Retained appropriately
- Monitored
Log Files
Some applications write logs to files.
For example:
  logs/
├── application.log
├── error.log
└── access.log
This can work for simple deployments.
However, storing logs only on the server has limitations.
If the server crashes or is replaced, logs may disappear.
For production systems, centralized log management is often preferable.
Log Rotation
Logs can grow continuously.
Imagine:
application.log
receiving thousands of entries every hour.
Eventually, the file could become extremely large.
Log rotation automatically creates new files or removes old logs.
Conceptually:
  application.log
      ↓
Reaches Size Limit
      ↓
Rotate
      ↓
application-2026-07-24.log
      ↓
Create New application.log
Log retention policies should be designed based on operational and compliance requirements.
Centralized Logging
In production, logs are often sent to a centralized logging system.
Conceptually:
  Node.js Server 1
       ↓
Node.js Server 2
       ↓
Node.js Server 3
       ↓
Centralized Logging System
       ↓
Search / Filter / Analyze
This is much easier than connecting to each server individually.
Centralized logging becomes especially important when applications run across multiple instances.
Logging and Containers
In containerized environments, applications commonly write logs to standard output and standard error.
For example:
  console.log("Application started");
console.error("Application failed");
The container platform can then collect and forward these logs.
This is one reason you should avoid assuming that application logs must always be written to local files.
The best strategy depends on your deployment environment.
Logging and PM2
If you're using PM2 to manage a Node.js application, PM2 can capture application output and errors.
Conceptually:
  Node.js Application
       ↓
PM2
       ↓
Process Management
       ↓
Logs
PM2 can also help with process restarts and production application management.
Logging, however, should still be designed intentionally rather than relying entirely on whatever process manager you're using.
Logging Performance
Logging itself consumes resources.
Excessive logging can increase:
- CPU usage
- Memory usage
- Disk usage
- Network usage
- Storage costs
For example, this can be problematic:
  for (const item of millionsOfItems) {
  logger.info("Processing item", {
    item
  });
}
You could generate millions of log entries.
Instead, consider summary logging:
  logger.info("Batch processing completed", {
  totalItems: millionsOfItems.length
});
Log meaningful events, not every single internal operation.
Good Logs vs Bad Logs
Bad:
Something happened
Better:
Failed to create user
Even better:
  {
  "level": "error",
  "message": "Failed to create user",
  "operation": "createUser",
  "requestId": "req_123",
  "error": "Duplicate email"
}
Good logs provide context.
What Should You Log?
A useful log may include:
  Timestamp
Log level
Message
Request ID
HTTP method
URL
Status code
Duration
Operation
Error information
Relevant identifiers
The exact fields depend on the event.
For example, an API request log might include:
  {
  "level": "info",
  "method": "GET",
  "path": "/api/users",
  "statusCode": 200,
  "duration": 45,
  "requestId": "req_123"
}
An error log might include:
  {
  "level": "error",
  "message": "Database query failed",
  "operation": "findUser",
  "requestId": "req_123",
  "error": "Connection timeout"
}
What Should You Not Log?
Avoid logging:
  Passwords
Authentication tokens
Refresh tokens
API keys
Private keys
Credit card numbers
Sensitive secrets
Unnecessary personal data
A useful rule is:
If someone gained access to your logs, would this information create a security or privacy problem?
If yes, don't log it.
Logging Strategy for a Node.js API
A practical setup might look like:
  Incoming Request
      ↓
Request Logger
      ↓
Request ID
      ↓
Controller
      ↓
Service
      ↓
Database
      ↓
Response
      ↓
Request Completion Log
If something fails:
  Error
  ↓
Central Error Handler
  ↓
Structured Error Log
  ↓
Safe HTTP Response
This creates a consistent observability foundation.
Example Production-Style Logger
A simplified Winston logger might look like:
  const winston = require("winston");

const logger = winston.createLogger({
  level:
    process.env.LOG_LEVEL || "info",

  format:
    winston.format.json(),

  transports: [
    new winston.transports.Console()
  ]
});

module.exports = logger;
Usage:
  const logger = require("./logger");

logger.info("Server started", {
  port: process.env.PORT
});

logger.warn("Slow request", {
  path: "/api/users",
  duration: 1200
});

logger.error("Database failure", {
  operation: "findUser"
});
This gives you a centralized starting point.
A Simple Logging Checklist
Before deploying a Node.js application, ask:
  1. Do we have consistent log levels?
2. Are errors logged?
3. Are requests traceable?
4. Do we have request IDs?
5. Are logs structured?
6. Are sensitive values excluded?
7. Can we search production logs?
8. Are logs retained appropriately?
9. Are excessive logs avoided?
10. Can we identify slow requests?
If the answer is yes, your application is much easier to operate.
Logging vs Monitoring
Logging and monitoring are related but different.
Logging
Logs tell you:
What happened?
Example:
Database connection failed
Monitoring
Monitoring tells you:
How is the system performing?
Example:
  Error rate: 8%
CPU: 85%
Memory: 92%
Average response time: 1.2 seconds
Observability
Observability combines multiple sources of information to help you understand the internal state of your system.
Common pillars include:
  Logs
Metrics
Traces
Logging is an important part of observability, but it is only one part.
We'll explore Performance Monitoring in Node.js later in this series.
What's Next?
Logging helps us understand what happened.
But sometimes we need to understand how well the application is performing .
An API may be returning successful responses while still being dangerously slow.
A server may be consuming too much memory.
A database query may take several seconds.
CPU usage may continuously increase.
These problems require performance monitoring.
In the next article, we'll explore Performance Monitoring in Node.js , including response times, CPU usage, memory usage, event-loop performance, profiling, metrics, and identifying bottlenecks.
Conclusion
Logging is one of the most important parts of building reliable Node.js applications.
At the beginning, console.log() may be enough.
As your application grows, however, you need a more structured approach.
A strong logging strategy should provide:
- Meaningful log levels
- Structured log data
- Request tracking
- Error logging
- Performance information
- Centralized logging
- Secure handling of sensitive data
- Appropriate log retention
The goal isn't to log everything.
The goal is to log the right information at the right time .
A good log should help answer:
  What happened?
When did it happen?
Where did it happen?
Why did it happen?
Which request caused it?
When your Node.js application enters production, good logs can be the difference between spending minutes diagnosing an issue and spending hours trying to reproduce it.
Treat logging as part of your application's architecture—not as an afterthought.