Debugging Node.js Applications: A Practical Guide to Inspector, Breakpoints, and DevTools
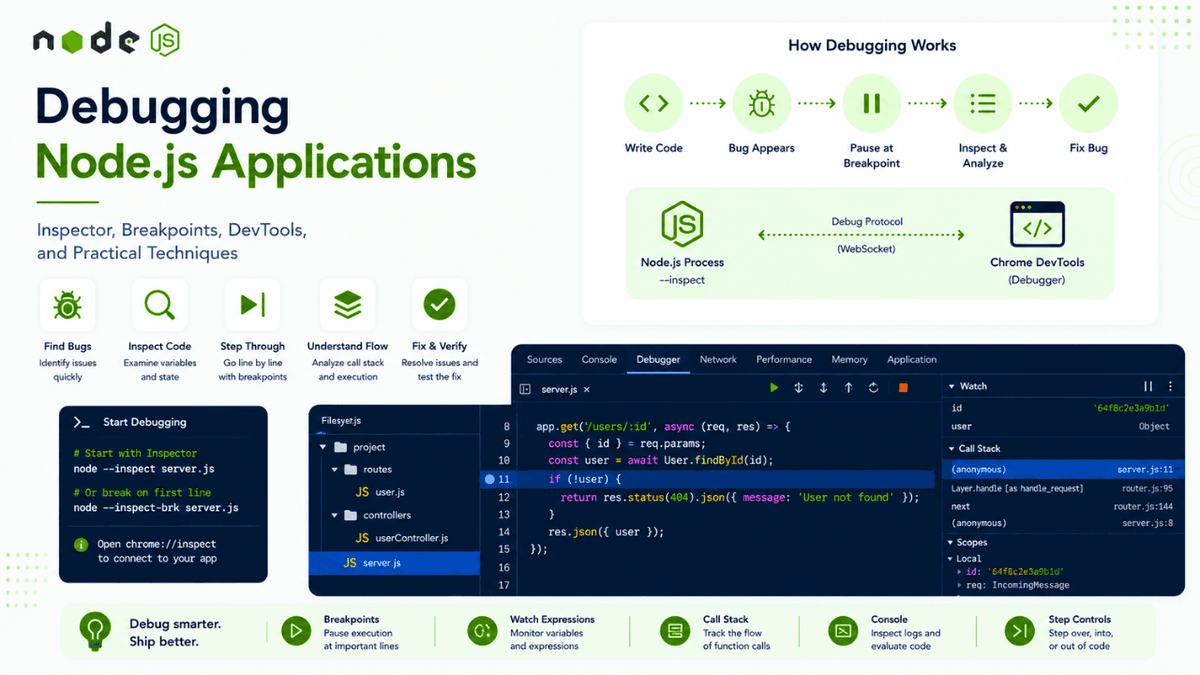
Learn how to debug Node.js applications effectively using console debugging, the Node.js Inspector, Chrome DevTools, breakpoints, watch expressions, stack traces, and practical debugging techniques.
Debugging Node.js Applications: A Practical Guide to Inspector, Breakpoints, and DevTools
Every developer eventually writes code that doesn't work as expected.
Maybe your API returns the wrong response.
Maybe a database query fails.
Maybe a variable contains an unexpected value.
Maybe your application crashes only in production.
The ability to find and fix these problems is one of the most important skills in software development.
This process is called debugging .
In Node.js, you have several tools available for debugging applications, ranging from simple console.log() statements to the Node.js Inspector and Chrome DevTools.
In the previous article, we learned how Nodemon can automatically restart our application when code changes.
Now we'll take the next step and learn how to investigate problems systematically instead of randomly changing code and hoping the problem disappears.
What Is Debugging?
Debugging is the process of identifying, understanding, and fixing problems in your application.
A typical debugging workflow looks like:
  Bug
 ↓
Reproduce the Problem
 ↓
Collect Information
 ↓
Identify the Root Cause
 ↓
Fix the Problem
 ↓
Test the Fix
The important part is identifying the root cause .
For example, imagine an API returns:
  {
  "total": 0
}
You might initially think the database is broken.
But after debugging, you discover:
  Database Query
      ↓
Returns Correct Data
      ↓
Wrong Variable Name
      ↓
Incorrect Response
The database wasn't the problem.
The actual problem was in the application logic.
Good debugging helps you find the real cause instead of guessing.
The Simplest Debugging Tool: console.log()
One of the most common debugging techniques is:
console.log();
For example:
  const user = {
  name: "Sachin",
  age: 25
};

console.log(user);
Output:
  {
  name: 'Sachin',
  age: 25
}
This helps you understand the value of variables during execution.
Logging Multiple Values
You can log multiple values:
  console.log("User:", user);
console.log("User ID:", user.id);
This is useful when debugging request handlers.
For example:
  app.get("/users/:id", (req, res) => {
  console.log("Request params:", req.params);

  res.json({
    message: "User fetched"
  });
});
You can now verify whether the expected parameters are reaching your server.
Using console.table()
When working with arrays or objects, console.table() can make the output easier to understand.
Example:
  const users = [
  {
    name: "Sachin",
    age: 25
  },
  {
    name: "Rahul",
    age: 28
  }
];

console.table(users);
This displays the data in a table-like format.
It can be particularly useful when inspecting lists of records.
Using console.error()
For errors, use:
console.error();
Example:
  try {
  throw new Error("Database connection failed");
} catch (error) {
  console.error(error);
}
This makes it clear that the output represents an error.
console.log() Is Not Always Enough
Console logging is useful, but it has limitations.
Imagine a complex function:
  function calculateTotal(items) {
  // 50 lines of logic
}
You might add:
  console.log("Step 1");
console.log("Step 2");
console.log("Step 3");
This can quickly become messy.
You also have to:
- Add logs
- Restart the application
- Reproduce the bug
- Read the logs
- Remove the logs later
A debugger provides a better way to inspect program execution.
What Is a Debugger?
A debugger allows you to pause your application while it is running.
You can then inspect:
- Variables
- Function calls
- Call stack
- Execution flow
- Expressions
- Application state
Instead of:
  Run Application
      ↓
Application Executes Everything
      ↓
See Final Result
You can do:
  Run Application
      ↓
Pause at Breakpoint
      ↓
Inspect Variables
      ↓
Step Through Code
      ↓
Find Problem
This is much more powerful for complex bugs.
Node.js Inspector
Node.js includes a built-in debugging capability called the Inspector .
You can start your application with:
node --inspect server.js
You may see output similar to:
Debugger listening on ws://127.0.0.1:9229/...
The Node.js process now exposes a debugging interface.
You can connect compatible developer tools to inspect your application.
Debugging with Chrome DevTools
You can use Chrome DevTools to debug Node.js applications.
Start your application:
node --inspect server.js
Then open the appropriate DevTools debugging interface in your browser.
Once connected, you can inspect your Node.js application.
The exact UI may vary depending on your browser and Node.js version, but the core debugging concepts remain the same.
Using --inspect-brk
Sometimes you want the application to pause immediately when it starts.
Use:
node --inspect-brk server.js
The --inspect-brk flag tells Node.js to start the Inspector and pause execution before running the application code.
This is useful when debugging startup problems.
For example:
  Application Starts
      ↓
Debugger Connects
      ↓
Execution Paused
      ↓
Inspect Startup Code
      ↓
Continue Execution
Breakpoints
A breakpoint tells the debugger:
Pause execution here.
For example:
  function calculateTotal(price, quantity) {
  const total = price * quantity;

  return total;
}
You can place a breakpoint on:
const total = price * quantity;
When the application reaches that line, execution pauses.
Now you can inspect:
  price
quantity
total
This allows you to understand exactly what is happening.
Why Breakpoints Are Powerful
Suppose your application returns the wrong result.
You could add:
  console.log(price);
console.log(quantity);
console.log(total);
Or you can pause execution and inspect all variables directly.
With breakpoints, you can also move through the code step by step.
This is extremely useful for complex logic.
Step Over
When debugging, Step Over executes the current line and moves to the next line.
Example:
  const user = getUser();
const name = user.name;
const response = createResponse(name);
Step Over allows you to move through these lines one at a time.
You can observe how variables change during execution.
Step Into
Step Into enters a function call.
Example:
const result = calculateTotal();
If you step into the function, the debugger moves inside:
  function calculateTotal() {
  // Debugger enters here
}
This is useful when you need to understand what a function is actually doing.
Step Out
Step Out allows you to finish the current function and return to the previous execution context.
This is useful when you've stepped too deeply into a function and want to return to the caller.
Call Stack
The Call Stack shows the chain of function calls that led to the current point.
For example:
  main()
  ↓
handleRequest()
  ↓
getUser()
  ↓
findUser()
If an error occurs inside findUser() , the call stack helps you understand how the application reached that point.
This is especially useful when debugging errors involving multiple layers.
Understanding Stack Traces
Consider:
  function first() {
  second();
}

function second() {
  third();
}

function third() {
  throw new Error("Something went wrong");
}

first();
The error output may contain a stack trace showing the execution path.
Conceptually:
  Error
  ↓
third()
  ↓
second()
  ↓
first()
The stack trace tells you where the error occurred and how execution reached that point.
Learning to read stack traces is an essential debugging skill.
Inspecting Variables
A debugger allows you to inspect variables at a specific moment.
For example:
  function calculatePrice(product, quantity) {
  const total = product.price * quantity;

  return total;
}
You might discover:
  product.price = 500
quantity = undefined
Now you immediately know why the calculation isn't working as expected.
Without inspecting the actual runtime values, you might waste time looking in completely unrelated parts of the application.
Watch Expressions
Watch expressions allow you to monitor specific values while debugging.
For example:
user.email
or:
cart.items.length
This is useful when you want to repeatedly inspect an expression while stepping through code.
Conditional Breakpoints
Sometimes a function runs hundreds of times.
You don't want the debugger to pause every time.
A conditional breakpoint allows you to pause only when a condition is true.
For example:
user.id === 100
The debugger pauses only when the condition matches.
This is particularly useful when debugging:
- Loops
- Large datasets
- Multiple requests
- Repeated function calls
Debugging Asynchronous Code
Node.js applications heavily use asynchronous operations.
For example:
  async function getUser() {
  const user = await User.findById(id);

  return user;
}
When debugging asynchronous code, pay attention to:
- Promise resolution
-
await - Callback execution
- Error handling
- Execution order
Sometimes the problem isn't that code didn't execute.
The problem is that it executed in a different order than you expected.
Debugging Promises
Consider:
  const data = fetchData();

console.log(data);
If fetchData() returns a Promise, data isn't the final result.
It is a Promise.
You may need:
  const data = await fetchData();

console.log(data);
Or:
  fetchData()
  .then(data => {
    console.log(data);
  })
  .catch(error => {
    console.error(error);
  });
Understanding asynchronous behavior is essential when debugging Node.js applications.
If you want to strengthen your understanding of this area, revisit the earlier article on Async Patterns in Node.js .
Debugging HTTP Requests
When debugging an API, inspect the complete request.
For example:
  app.post("/users", (req, res) => {
  console.log("Body:", req.body);
  console.log("Params:", req.params);
  console.log("Query:", req.query);
  console.log("Headers:", req.headers);

  res.json({
    message: "Request received"
  });
});
This helps you verify whether the client is actually sending the data you expect.
A useful debugging checklist is:
  Request URL
    ↓
HTTP Method
    ↓
Headers
    ↓
Query Parameters
    ↓
Route Parameters
    ↓
Request Body
    ↓
Server Logic
    ↓
Database
    ↓
Response
Debugging becomes much easier when you inspect each layer systematically.
Debugging Database Queries
Suppose your API returns:
  {
  "users": []
}
Don't immediately assume the database is empty.
Check:
  Request
  ↓
Query Parameters
  ↓
Query Construction
  ↓
Database Query
  ↓
Database Result
  ↓
Response Transformation
For example:
  const users = await User.find({
  role: req.query.role
});

console.log("Query role:", req.query.role);
console.log("Users found:", users.length);
This helps identify where the problem occurs.
The issue could be:
- Incorrect query
- Wrong parameter
- Wrong database
- Wrong collection
- Missing data
- Incorrect response mapping
Debugging Environment Variables
Environment variables are another common source of bugs.
For example:
  console.log(process.env.MONGO_URI);
console.log(process.env.PORT);
If a value is undefined , investigate:
- Is the
.envfile loaded? - Is the variable name correct?
- Is the application running from the expected directory?
- Was the application restarted after changing the environment?
Never log sensitive secrets such as passwords or API keys.
Instead, inspect whether the value exists:
  console.log(
  "MongoDB URI exists:",
  Boolean(process.env.MONGO_URI)
);
This is safer.
Debugging Error Handling
Consider:
  try {
  const user = await getUser();
} catch (error) {
  console.error(error);
}
Don't hide useful error information.
Bad:
  catch (error) {
  console.log("Something went wrong");
}
Better:
  catch (error) {
  console.error("Failed to get user:", error);
}
In production, use structured logging rather than relying entirely on console output.
We'll explore proper Logging in Node.js later in this series.
Debugging Memory Problems
If your application becomes slower over time or crashes with memory-related errors, you may have a memory issue.
Potential causes include:
- Memory leaks
- Large objects
- Unbounded caches
- Too many connections
- Long-lived references
Node.js provides debugging and profiling tools that can help investigate memory usage.
For example, you can start the application with:
node --inspect server.js
Then use developer tools to inspect memory and performance.
This becomes especially important for long-running production services.
Debugging Performance Problems
Not every bug is a crash.
Sometimes the application works but is too slow.
You may need to investigate:
  Slow API
   ↓
Slow Function?
   ↓
Database Query?
   ↓
External API?
   ↓
CPU-Intensive Task?
   ↓
Memory Pressure?
Profiling tools can help identify where time is being spent.
Performance monitoring becomes especially important when applications move into production.
We'll cover Performance Monitoring in Node.js later in this series.
Debugging with Nodemon
During development, Nodemon can improve your debugging workflow.
Instead of manually restarting:
node server.js
you can use:
npm run dev
with a script such as:
  {
  "scripts": {
    "dev": "nodemon server.js"
  }
}
The workflow becomes:
  Change Code
    ↓
Nodemon Restarts
    ↓
Reproduce Bug
    ↓
Debugger Inspects Code
    ↓
Fix Bug
Nodemon handles application restarts.
The debugger helps you understand the problem.
Together, they create a productive development workflow.
A Practical Debugging Workflow
When you encounter a bug, follow a systematic process.
Step 1: Reproduce the Bug
First, make sure you can consistently reproduce the problem.
Ask:
What action causes the bug?
Step 2: Read the Error
Don't immediately skip the error message.
Read:
- Error type
- Error message
- File name
- Line number
- Stack trace
Step 3: Identify the Failing Layer
Determine whether the issue is related to:
  Client
API
Business Logic
Database
External Service
Configuration
Step 4: Inspect Runtime Values
Check the actual values of variables.
Use:
console.log()
or a debugger.
Step 5: Use Breakpoints
If the problem is complex, pause execution at the relevant point.
Step 6: Test Your Hypothesis
Don't randomly change code.
Ask:
What do I think is causing this?
Then test that assumption.
Step 7: Fix the Root Cause
Avoid hiding symptoms.
Fix the underlying problem.
Step 8: Test Again
Verify that:
- The original problem is fixed.
- Existing functionality still works.
- Edge cases are handled.
Common Debugging Mistakes
Changing Random Code
Random changes make debugging slower.
Always form a hypothesis first.
Ignoring Error Messages
Error messages often tell you exactly where to start.
Adding Too Many Logs
Too many logs can make output difficult to understand.
Use targeted logging.
Debugging Only the Final Output
Inspect the entire data flow.
The bug may happen several steps before the final result.
Not Reproducing the Bug
If you cannot reproduce a problem, it's difficult to know whether your fix actually worked.
Development vs Production Debugging
Debugging in development is different from debugging production systems.
In development, you might use:
  console.log()
Debugger
Breakpoints
DevTools
In production, you typically need:
  Structured Logs
Error Tracking
Metrics
Tracing
Monitoring
Never expose sensitive information through production logs.
Production debugging requires careful observability and security practices.
Debugging Checklist
When something goes wrong, ask:
  1. Can I reproduce the problem?
2. What exactly is failing?
3. What does the error message say?
4. Where does the error originate?
5. What are the runtime values?
6. Is the problem synchronous or asynchronous?
7. Is the database involved?
8. Is an external service involved?
9. Can I isolate the failing function?
10. Can I reproduce it with a smaller example?
This process helps turn debugging from guesswork into a repeatable engineering practice.
Conclusion
Debugging is one of the most important skills a Node.js developer can develop.
Simple tools like console.log() are useful for quick inspections, but complex applications benefit from proper debugging tools and techniques.
The Node.js Inspector, breakpoints, call stacks, watch expressions, and developer tools allow you to understand exactly what your application is doing while it runs.
The most important lesson is to debug systematically.
Don't randomly change code.
Instead:
  Reproduce
   ↓
Understand
   ↓
Inspect
   ↓
Hypothesize
   ↓
Test
   ↓
Fix
   ↓
Verify
Once you develop this mindset, debugging becomes less frustrating and much more predictable.
A strong developer isn't someone who never creates bugs.
A strong developer is someone who can quickly understand why a bug happened and confidently fix the underlying problem.